Risk and related assets will likely sell-off soon.
Friday 28 May 2010
Market is likely to break lower from current levels
I believe that we are approaching the end of the correction that began on Tuesday of this week.
Friday 21 May 2010
Kiss of Death?
First, my alternative, temporarily bullish count. On a number of metrics, this market is extraordinarily oversold. Usually, this would lay the foundation for a healthy rally. To accommodate this scenario, I propose an eminently probable count.
On this hourly chart of the CAC40, we may have just finished the "B" wave, pending a near vertical rally to just above (or so) the levels we saw after EU-TARP was announced. If so, it would be a wonderful shorting opportunity!

Following the biggest market drop since March 2009, the market is, I believe, retracing to the broken trendline. This is also known as the "kiss of death".
I expect the market to fall away from this point. In addition, should today's lows be taken out on the major indices, (where those lows coincide with the "flash crash lows" of May 6), the bottom is likely to fall out of the market.
This is a daily chart of the US Energy Sector, which today touched the underside of horizontal resistance in red.

This is a daily chart of JPMorgan, and the chart looks very similar to that of the whole US Financial sector. Today, the stock touched the underside of the broken trendline, in red.


Wednesday 19 May 2010
Crossroads
The market is at a crossroads.
If we take out the lows of today, the market is likely to fall in a waterfall, wave 3 decline. If the market takes out yesterday's highs, it is likely that we go on to challenge post EU-bailout highs in wave C of II (or B).
I lean strongly towards an immediate breakdown for a number of reasons. A few of those are time cycles, a number of large cap stocks in G10 are very weak, and the low today has been made in a three-wave corrective spike, suggesting that it was a "b" wave of an irregular correction, pending more downside.

Thursday 13 May 2010
Correction Higher Is Likely Over
The aftermath of the "flash crash" and the European debt crisis is long forgotten, as markets are challenging strong resistance levels (highlighted by the red line in the hourly chart of the SP500 futures in the chart below).
The entire advance from the "flash crash" low appears to be taking shape of a zig-zag, with several hallmarks that define such structures: a) very sharp movements; b) wave "a" and "c" equality; c) diminishing volume relative to the impulsive move that preceeded it; d) retracement of the "extension".
It is therefore my belief that global equity markets are about to take the turn for the worse imminently (within the next 2-3 trading sessions).

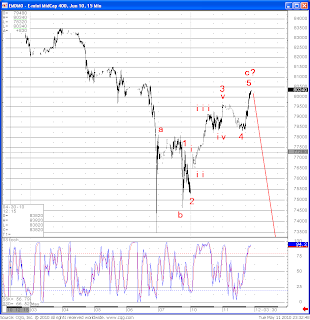
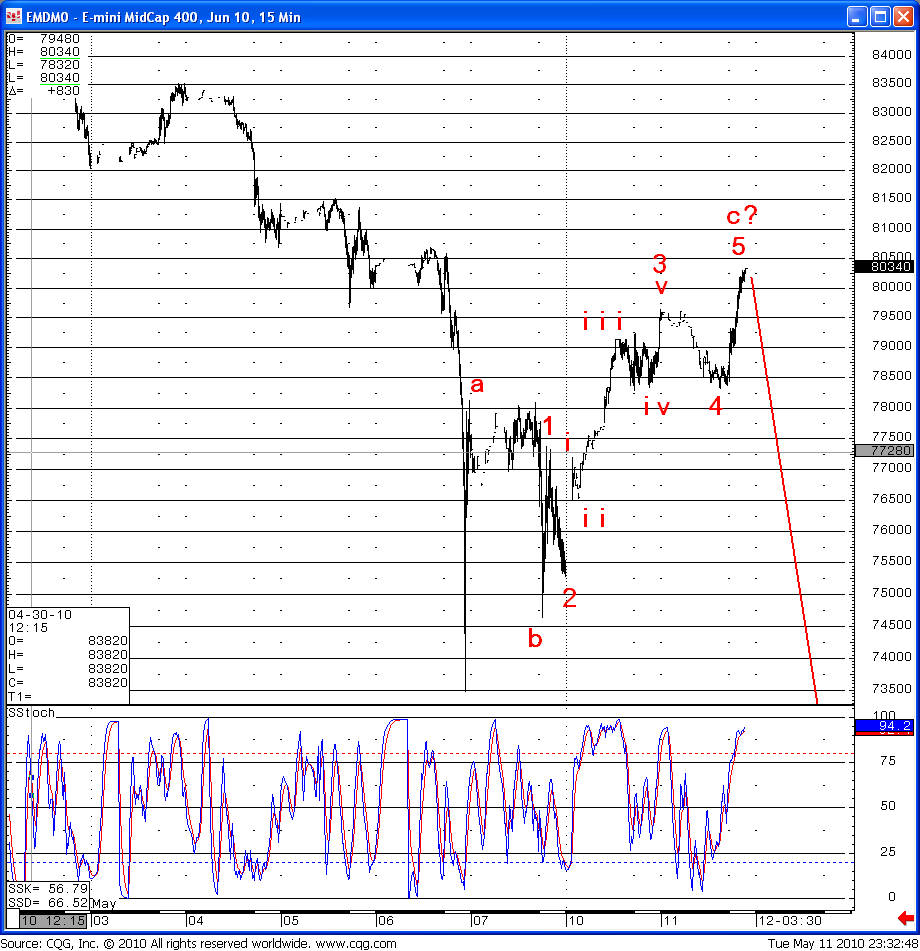
Tuesday 11 May 2010
Corrections Higher Likely Finished
It is likely that the bail-out induced euphoria will very soon give way to dispair, as equities turn around and head lower.
This is an hourly chart of the US Mid-caps, which highlights a very technical, so far, corrective zig-zag higher. I believe it is about to reverse.
This is an hourly chart of the US Mid-caps, which highlights a very technical, so far, corrective zig-zag higher. I believe it is about to reverse.
Monday 10 May 2010
Fool's Gold - Sell This EU Spike
Markets have taken a few Ecstasy pills and are seriously high. I do not think this will last.
Major European and US averages traced out beautiful corrective zig-zags to the upside. Similarly, the time-old market indicator - Copper is also quite weak today, and is likely finishing its correction higher.
Finally, Asian indices have not at all participated in this rally, even though they fell a fair bit in line with Europe.
In short, go SHORT.
Thursday 6 May 2010
Correction Underway
Markets complied with very strong indications of reversals.
Currently, it appears that the moves from end of April highs are coming to an end. It is quite likely that we consolidate for a few days, then make one more low, and then consolidate for much longer.
It appears that EUR and CHF are basing against the USD.
Subscribe to:
Posts (Atom)