Wednesday 24 February 2010

Correction Higher In Risk: Correcting The Correction

The outlook right now is less clear than it has been for the past six weeks. I do not think that the decline from January to February has been corrected, and therefore expect more "thrusts" higher. At the same time, I expect those "thrusts" from a lower base, perhaps from around the levels of the February low.

Below is a four-hourly chart of the Nasdaq100. I think it could easily drop to February lows (-5%), and then rally back to the highs of this week to complete the correction. In October/November 2007, this very index travelled up and down around 5.5% in 11 trading days (second chart, below). At the time, the VIX was trading around 20%, same value as today.

In short, I cannot see prices breaking down into a waterfall decline before more corrective action is seen.

Nasdaq100, four-hourly

Nasdaq100, hourly, October/November 2007

Monday 22 February 2010

Weakness In Risk And Related Assets

Some part of correction higher in risk and related assets has likely ended. It is now very likely that equities, Japanese Yen crosses and other instruments correlated to Risk will sell-off.

One characteristic of the multi-week rally in risk that I proposed on 5 February has been an extremely uneven pace of recovery. Some indices made new highs (Swiss Market Index); others have retraced over 2/3 of their declines (the majority of US indices); while others have barely managed to take out 1/3 or their declines (most Europeans, and particularly the PIGS). This, of course, hints at a lack of breadth, on a global scale. To me, it also suggests forthcoming weakness.

At the same time, breadth hasn't been damaged to an extent that suggests imminent vicious declines. I expect to see a re-test of February lows, and then a strong to very strong rally before we can talk of a multi-month top.

Below is an hourly chart of the Spanish IBEX. A re-test of the lows seems to me to be a done deal here.

This is an hourly chart of the Italian MIB. Not much to build on a bullish case here either.
Finally, an hourly chart of the German DAX. While stronger than its Southern European peers, this index looks very tired at current levels. At a minimum, I expect it to decline to the middle of the consolidation centred at 5500.

Wednesday 17 February 2010

Correction Higher In Risk: Correcting The Correction

BOTTOM LINE: Risk and related assets have likely completed one leg of the ongoing correction higher. We will now likely see softening in risk appetite, which could take the whole of this week. I do not anticipate a significant breakdown in asset prices yet.

This is a four-hourly chart of the German DAX. I believe we are about to begin correcting the correction, which will produce a messy, erratic and volatile range.

This is a four-hourly chart of the mid-caps index in the USA. Mid-caps (and tech) have been much stronger than blue-chips, which suggests that substantial weakness is unlikely in the near-term.

Tuesday 16 February 2010

Correction Higher In Risk

BOTTOM LINE: The anticipated weakness in Risk and related assets did not materialise, as risk corrected in a sideways, triangular way. That has likely been a "B" wave of the whole correction, and I now expect strength in wave "C".

Below is a four-hourly chart of the German DAX. I am surprised at how weak corrections higher in European indices have been so far.

Friday 12 February 2010

Correction Higher In Risk

BOTTOM LINE: Equities and related risk assets have likely completed some stages of their corrections higher. I believe it is now likely that weakness reappears.

No charts today.

Tuesday 9 February 2010

A Multi-Week Advance Has Likely Begun

BOTTOM LINE: Last Friday's low did indeed turn out to be a low of some kind. Whether this low holds for a few weeks remains to be seen. For now, provided this Monday's lows hold, I consider the likelihood of a multi-week rally to be very high.

For all my bullishness, I am very careful at these pivotal levels. Should markets show weakness, particularly below levels we saw only yesterday, I would shift to a neutral stance.

Below is a four-hourly chart of the German DAX. In the next few weeks, this index could rally all the way to 5800.

This is the Straits Times index from Singapore. A very clear impulse can be seen from the highs. It is likely that some time and further price appreciation will be needed to clear the oversold condition.

This is an hourly chart of the Australian ASX index. Being a highly sensitive economy to the global growth cycle, Australia merits particular attention. The charts are extremely clear for this index, and suggest a strong rebound.

Stocks remain deeply oversold on a number of metrics, one of which is the number of stocks trading above their 50 day moving averages. As can be seen from the chart below, stocks are now more oversold than at the ends of two major corrections to the March'09-January'10 rally. While this and other breadth indicators could fall further, I consider the possibility remote.

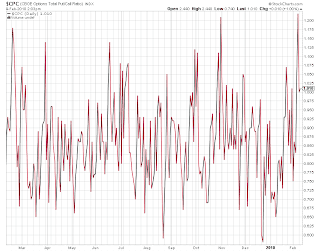
The Call-Put ration spiked to a level associated with major market bottoms, and has since turned. Again, it is likely that some degree of price stability is ahead.

Friday 5 February 2010

The Lows In Risk And Related Assets

BOTTOM LINE: The sell-off that began in the second week of January 2010 is likely coming to its end around current levels. I expect there to be a multi-week advance or at a minimum expanded range trading, with some indices challenging their recovery highs.

Below is a 4 hourly chart of the German DAX. The index fell in a beautiful five wave impulse from the high of the move, with very clear internal structure. The final drop, which started at 4 is almost over, and a fifth wave low is expected shortly (today-Monday).

On a number of metrics (for example SP100 percentage of stocks above 50 DMA and the McClellan Oscillator, both below), the market is now more oversold than it has been at the July 2009 and November 2009 lows, and nearly as oversold as in March 2009. Therefore, I expect a rather strong bounce, of about 5-8% in major averages.