Friday, 22 May 2009

Sell-off in risk?

The BKX (KBW Philadelphia Banking Index) has underperformed the broader market this week. So far, it is showing strong bearish signs, and provided the highs of Wednesday at 40.09 (~11% from here) don’t give way, we are set for a substantial decline.
KBW/PHIL BANKING INDEX HOURLY

The Dow Jones Semiconductors Index also underperformed the broader market, and is tracing out a decidedly bearish pattern. A major degree wave IV likely finished at 8039 on 8 May 2009, and the index since fell in a clear five wave move down, which has then been retraced in a corrective fashion. This sets it up for a fall in the coming weeks. Targets extend to below November lows, around 30% lower.
DOW JONES SEMICONDUCTORS INDEX DAILY

Sterling has outperformed both the Euro (on these charts) and the Swiss Franc (not shown) since the March low in equities. It has since rallied in what appears to be a clear, finished impulsive fashion, that is likely a “c” wave of a larger, flat correction. If that is the case, Sterling is likely to weaken in the weeks ahead. This is likely to coincide with weakness in equities.
GBP/EUR DAILY

GBP/EUR 4 HOURLY

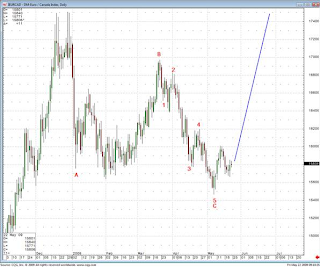
One of the indicators of “risk appetite”: Euro against the Canadian dollar. I believe that this cross has bottomed, medium- to long-term at 1.5460. It has since rallied in an impulsive fashion, and is getting ready to rally to about 1.70 as a first target. This is likely to coincide with substantial weakness in equities.
EUR/CAD DAILY

EUR/CAD 4 HOURLY

Thursday, 21 May 2009

What will kill this rally...? The banks, pt 3.

The banks started to underperform the broader market. Together with the BKX patterns looking bearish, this bodes ill for the broader risk assets.


Medium-term, bonds, JPY and USD are to rally; equities and commodities to come off.


Friday, 8 May 2009

Shoot a green shooter - Soybeans.

Soybeans are a great commodity to trade on a wave principle. Below is my count for Soybeans, which suggests that we are about to embark on a substantial decline. Also, Copper and the S&P / GSCI Commodity Index look toppy.

FTSE / XINHUA 25 ETF (a proxy for China) is topping.

This ETF has become a popular way to express a view on China (it includes China Mobile, ICBC, China Life, Petrochina, Bank of China, etc.). I believe that both daily and hourly chart are signalling an imminent reversal of fortunes for this instrument (and with it, likely for the rest of the world's stocks).

FTSE/Xinhua 25 China ETF, Daily chart. Please note perfect equality of the "A" and "C" wave, as well as substantial MACD divergences against which new highs were made within the "C" wave.

FTSE / Xinhua 25 China ETF, hourly chart. The "C" wave subdivides very well into 5 sub-components, with a five wave move from "4" to "C,5" clearly visible. This suggests that the move UP is over.

Thursday, 7 May 2009

Risk may have topped for 2-3 months.

Well, it may have finally happened, and we may have seen the highs for stocks for a couple of months.
There are a few great topping patterns among technology stocks, I'll start with the Nasdaq100, which is leading the way down right now. It has penetrated quite an important trendline [red] that connects wave 2 and wave 4. Classically, this signals the end of the uptrend, AND this has not happened so far in this relentless, 8 week rally.

Wednesday, 6 May 2009

What will kill this rally...? The banks.

A very plausible count, to my eyes.

This rally is dead.

Monday, 4 May 2009

Dead man walking

... yes, well, I am referring to myself... Although I do think that it ought to be the market.


For what it is worth, I think that given:

1. Clear finishing patterns on JPY crosses, such as AUD/JPY, CAD/JPY & NZD/JPY;

2. The VIX staying above its April lows;

3. Credit spreads flat to widening

the next major move in risk will be down.


To that end, I am short AUD/JPY in size. Because I believe that a move lower in X/JPY is likely to drag stocks and risk lower with it, I prepared a count under which it is possible for stocks to fall. This is a fairly long shot. But then this rally has been a bit of a long shot, with barely ANY retracements. And no rally off a major bottom has been without retracements.